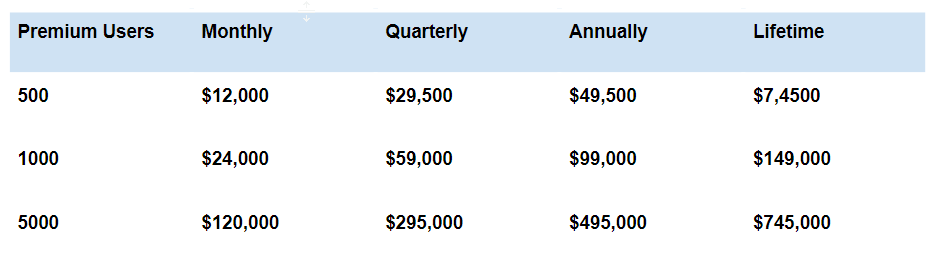
The scale below shows you the potential revenue from the Dating Market that you can make with your membership plans. This is not a guarantee; it only shows the potential income based on your plan’s price. It is not based on actual activity or data from your site.
The scale below is based on the membership price of $24 (monthly), $59 (Quarterly), and $149(lifetime). Your plans and prices could be different, and due to this, the revenue might not be the same as projected below.
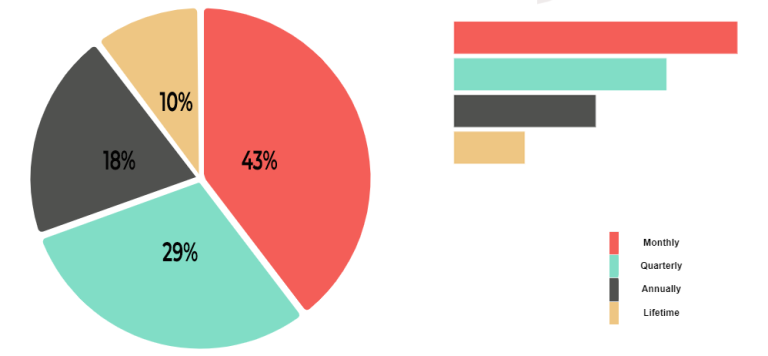
The below graph shows the average membership purchase breakdown. This will give us an idea of what membership your users would most likely purchase. This is based on monthly, quarterly, annually, and lifetime membership plans.
Overall, a monthly is the most popular plan among users followed by annual and lifetime plans. This means that we should consider having a variety of pricing plans for our users to choose from when they are buying a membership.
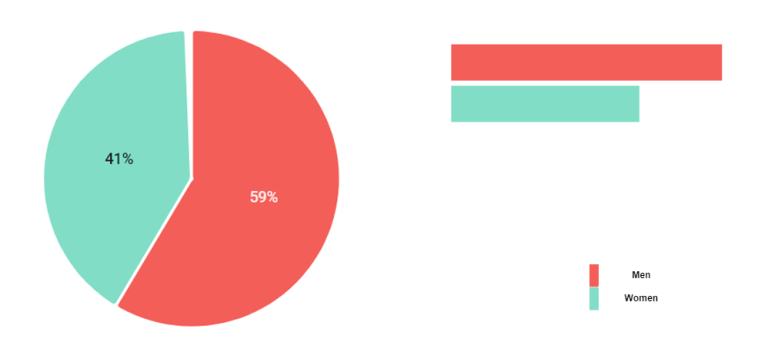
The below graph shows the average gender membership purchase breakdown. This will give you an idea of the memberships that the male and females are purchasing. Custom members are not cited in the graph below.
Just looking at this graph, it appears that men purchase more than women. However, this is not always the case as there are many factors that go into deciding whether someone will purchase a membership or not.
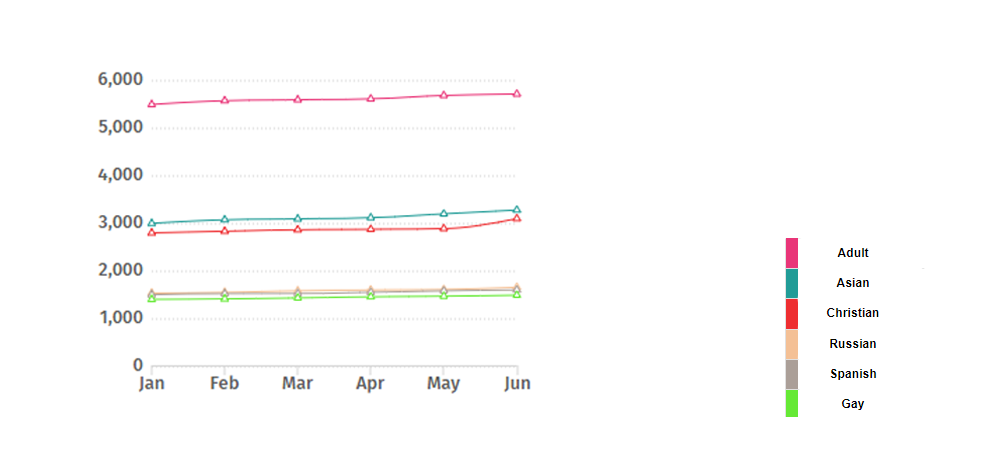
The below graph shows the average monthly income that customers reported in the 6 months of 2022. We surveyed three participating sites within each of the below niche six markets. Each month shows the average income that the market brought in. These are the data from established sites developed using the WP dating plugin. These figures do not show how much you will make from your site but show the potential of what you could make.
*The above graph shows a lot of potential in these markets. However, we recommend you consider your niche and how well it can be converted into a profitable business.
The below graph shows the average monthly income that customers reported in the 6 months of 2022. We surveyed three participating sites within each of the below niche six markets. Each month shows the average income that the market brought in. These are the data from established sites developed using the WP dating plugin. These figures do not show how much you will make from your site but show the potential of what you could make.
*The above graph shows a lot of potential in these markets. However, we recommend you consider your niche and how well it can be converted into a profitable business.